Table of Contents
Classic Guidelines
Guidelines for Selecting Observing Settings for Classic
For stars brighter than K < 5.5 mag, use destructive mode.
For stars fainter than K > 5.5 mag, use non-destructive mode if needed.
If possible, stay at 750 Hz so that the noise peaks are furthest from the fringe window.
If recording in non-destructive mode, check for saturation on the brightest target in the observing sequence. Saturation occurs at a sum of ~ 300 counts (150 counts per pixel). If the sum of counts is close to 300, then click the “DIFF/SIG” button on the CLASSIC GUI. Saturation occurs when the signal in the DIFF/SIG window flatlines at the end of the scan (maybe we can get a screen shot to show what saturation looks like). If the signal is saturating, then you need to record at a faster (higher) rate.
You don't have to worry about saturation in destructive mode.
To determine the best camera speed, go to the faintest star in the bracket:
- In H-band you want the sum to be at least 50 counts (H-band has very little background)
- In K-band you want the sum to be at least 50 counts + the background. Close both shutters to estimate the counts in the background.
In general, use the long scan length. But if the seeing is very good and the fringes aren't bouncing around in the waterfall, you might want to try the short scan.
Alignment Procedure for Classic
Re-align NIRO about once every hour. Make sure that you complete a calibration bracket before aligning and before moving the reference cart. Both of these can change the calibration.
When re-aligning, please set a new reference cart position to optimize delay before doing the NIRO alignment. This is especially important for fast-moving baselines. Ideally, one should wait until the reference cart moves to the correct position before starting the NIRO alignment.
Observing Logs
Please record the data entries into the electronic observing logs. In the comments section, please make a note of the camera settings and indicate when NIRO alignments are done or if the reference cart position was moved.
https://sites.google.com/a/chara-array.org/chara-observing/
Other Important Notes
- Keep an eye on the data sequence. Please check to make sure the fringes are in the scan window after the first shutter sequence finishes. This will save time and avoid large gaps in the recording sequence.
- When clicking SAVE to start recording data, please visually confirm that the SERVO is ON. If the servo is not on, then the position of the fringes might drift across the window.
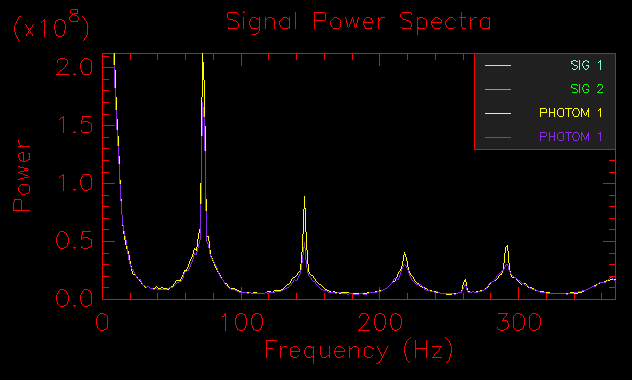
- After the fringe data have been collected, please look at the power spectrum plots to see if there are any problems with noise peaks showing up in the data. If there are noise peaks in the power spectrum then the cause of these peaks should be investigated (vibrations in the lab? telescope oscillations? electronic noise?).
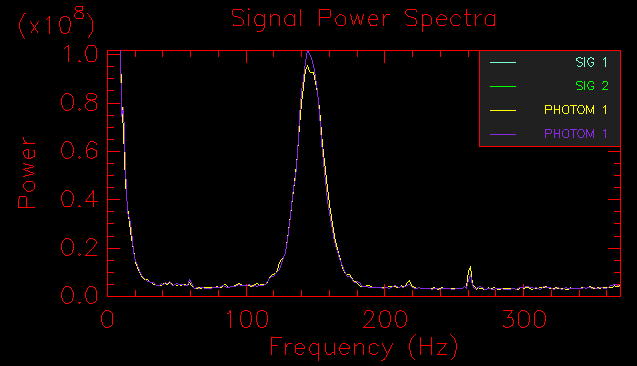
This is how the power spectrum for good data should look (at 750 Hz sampling, the fringe power shows up at 150 Hz):

This is an example of noise spikes from telescope oscillations contaminating the power spectrum (there is a narrow noise peak showing up at the data frequency of 150 Hz, and several other peaks showing up at different frequencies):
