Spotted Magnetic Stars
Sunspots and starspots are cooler, darker areas on the surface of a star that form when stronger regions of the magnetic field block the flow of heat and energy in patches. The high angular resolution of the CHARA Array can be used to image the surfaces of stars and study starspots on magnetically active stars.
Magnetically Active Star - Zeta Andromedae
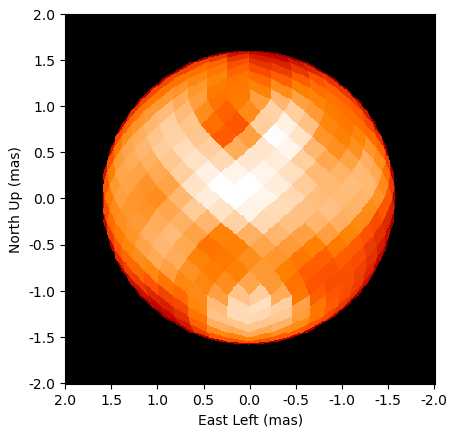
Researchers used the CHARA Array to build the first time lapse images of the star zeta Andromedae across one of its 18-day rotations. Zeta Andromedae is about 181 light-years away in the northern constellation of Andromeda.
The pattern of spots is very different from how they're typically arranged on our sun. The findings challenge current theories of how stars' magnetic fields influence their evolution. At the same time, they give scientists a glimpse into how the sun likely behaved in its infancy, when the solar system was forming billions of years ago.

On the sun, spots form in bands just above and below its equator. This is not the case for zeta Andromedae. The images show one starspot in the star's northern polar region and several additional spots spread across lower latitudes. Previous studies that used indirect approaches to find spots suggested that stars with strong magnetic fields could, in fact, harbor them near their poles, but that couldn't be verified until now.
The images unambiguously show a polar starspot on zeta Andromedae for the first time. Additionally, the spots aren't restricted to forming only in symmetric bands around the equator as sunspots are. The starspots on zeta Andromedae are in both hemispheres and at all different latitudes. This can't be explained by extrapolating theories about the sun's magnetic field.
The lower latitude spots are spread over an extended cool region, suggesting that magnetic fields can suppress heat flow across a large part of the star's surface, rather than just in spots. Astronomers use star temperatures to estimate their ages, so they need to know if anything, such as these extended cool regions, is throwing off those temperature measurements.
Zeta Andromedae is a binary system - a bright giant star locked in orbit with a smaller unseen companion. The bright giant has a radius 15 times larger than the sun. Interactions with its companion have sped its spinning so much that it finishes a full rotation in less than three weeks (Earth time) despite its additional girth, when compared to the sun. It has unusually strong magnetic activity.
Young star that have recently form also spin fast as they take in material from disks of dust and gas that surround them and contract in the process. A similar mechanism generating the magnetic field of zeta Andromedae might be at work in young stars too.
Nowadays, the sun rotates about once every 24 days, and the number of sunspots ebbs and flows along with the sun's 11-year magnetic activity cycle. More sunspots signal more magnetic activity and, on Earth, greater potential for geomagnetic storms that could damage satellites and the electrical grid. Astronomers believe the sun spun a lot faster when it was younger. Studying spots on solar-like stars of different ages helps us understand the fundamental physics behind magnetic field generation and how that changes over time. This is important for developing a picture of the early, current and future behavior of the sun's magnetic field.
References: Roettenbacher et al. 2016, Nature, 533, 217
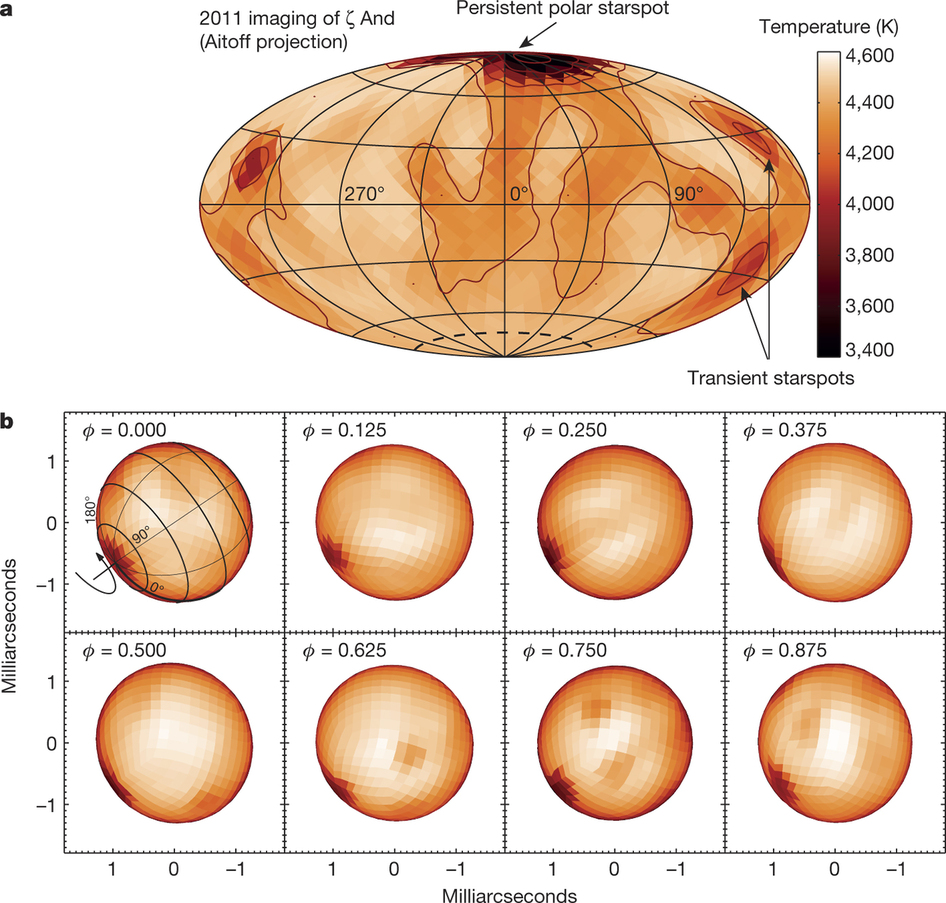
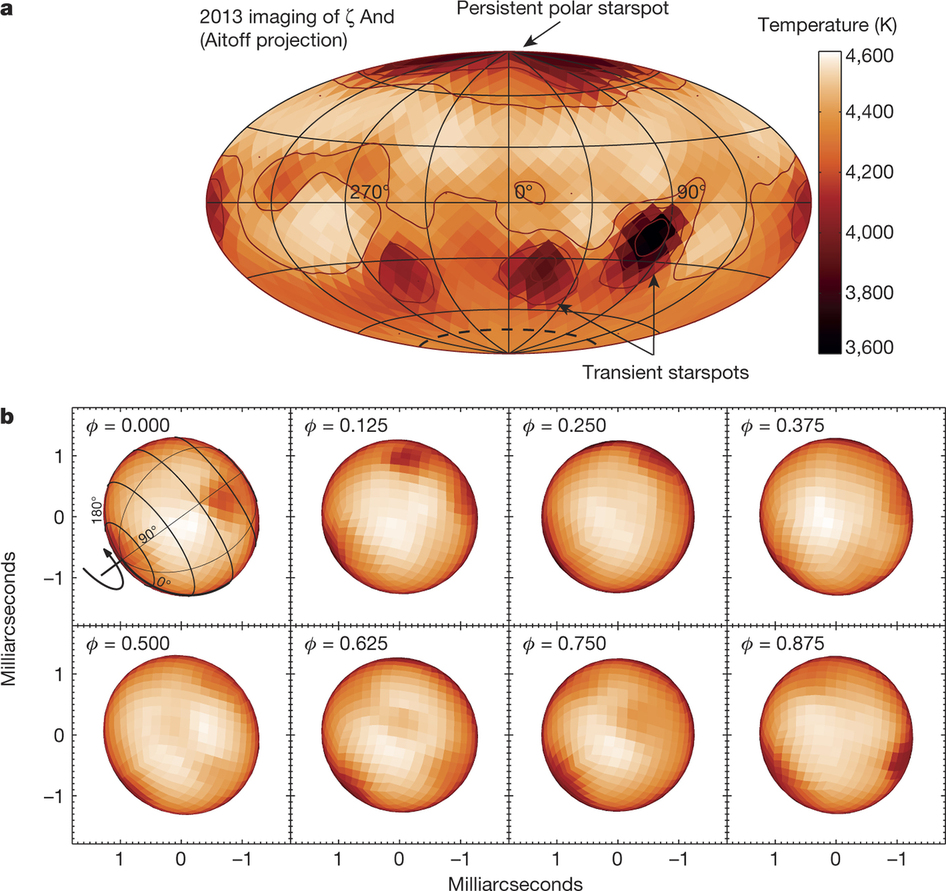 Surface images of zeta Andromedae from July 2011 (left) and September 2013 (right). The upper panels labelled (a) show the temperature of zet And as an Aitoff projection. The contours represent every 200 K from 3,400 K to 4,600 K. The dashed line at the bottom pole indicates the latitudes below, which are hidden owing to the inclination. Arrows point to example transient starspots. In the lower panels labelled (b) the surface reflects how the star is observed on the sky with H-band intensities (mean H = 1.64). The phase ϕ = 0.000 plot shows longitude 0° at the bottom right of the star with 90° across the middle. The phases assume circular orbit radial velocity conventions. The images are oriented with north up and east to the left. Image credit: Roettenbacher et al. 2016, Nature, 533, 217
Magnetically Active Star - Sigma Geminorum
Sigma Geminorum is another magnetically active star that was imaged with CHARA Array over its 19.6 day rotational period.

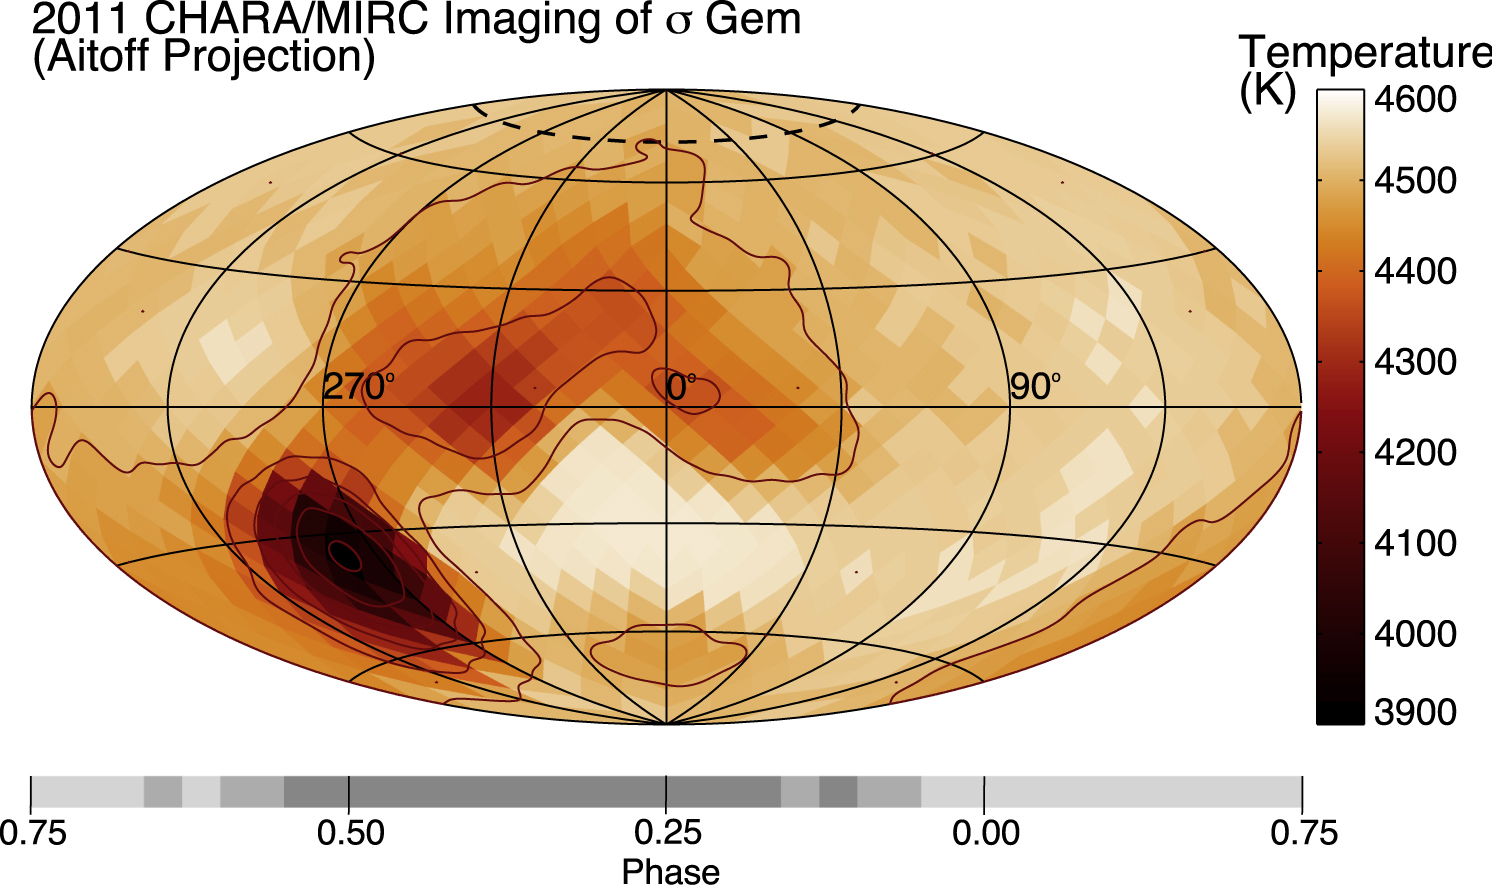
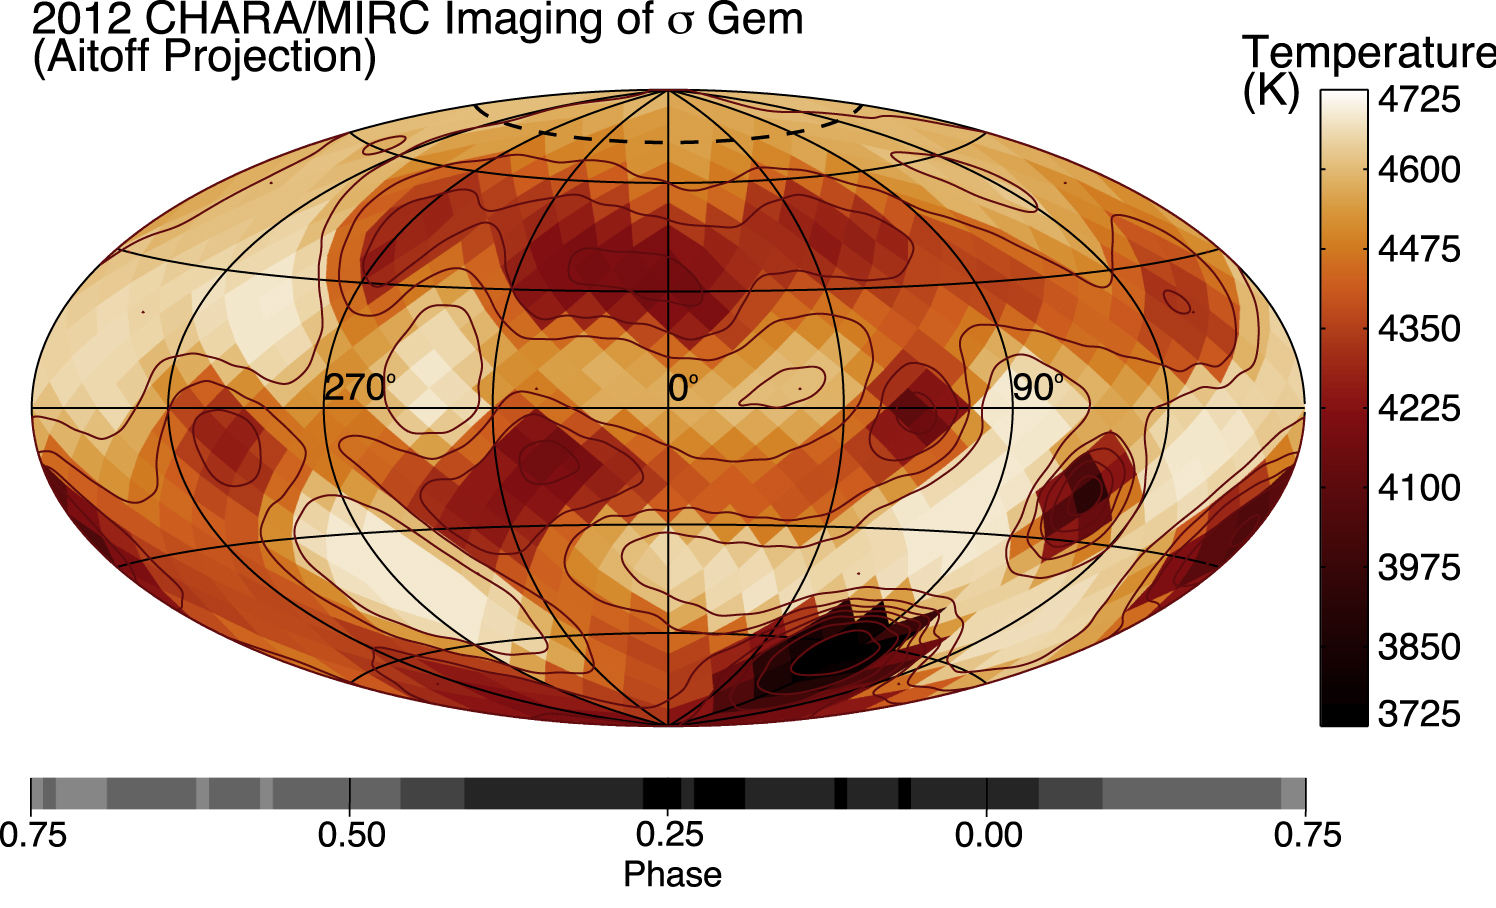 Surface images of sigma Geminorum from 2011 (left) and 2012 (right). The Aitoff projections show the surface temperature with the appropriate color scale to the right of the projection. The latitudes hidden by stellar inclination appear above the dashed line around the top pole. Each contour represents 100 K. The gray bar beneath the Aitoff projection represents the number of times each phase was observed with MIRC, with darker grays indicating more observations.
Reference: Roettenbacher et al., 2017, ApJ, 849, 120.
Spots on the Surface of the North Star - Polaris
CHARA images recently revealed spots on the surface of Polaris. More details can be found in the recent press release.
