
Stellar Diameters
The CHARA Array measures the sizes of stars across a large range of masses and evolutionary stages (e.g., Boyajian et al. 2012a, 2012b, 2013). The angular diameter of a star, when combined with the stellar parallax (measured through astrometric missions like Hipparcos or GAIA), provides a direct measurement of the physical radius of the star. If the bolometric flux of the star is measured from its spectral energy distribution, then an empirical measurement of the stellar effective temperature can be derived through Stefan's Law (Fbol = ¼ θ2σT4). The fundamental parameters of a star (radius, effective temperature, luminosity) can be compared with evolutionary models to estimate the mass and age of a star (e.g., Jones et al. 2015, Ligi et al. 2016).
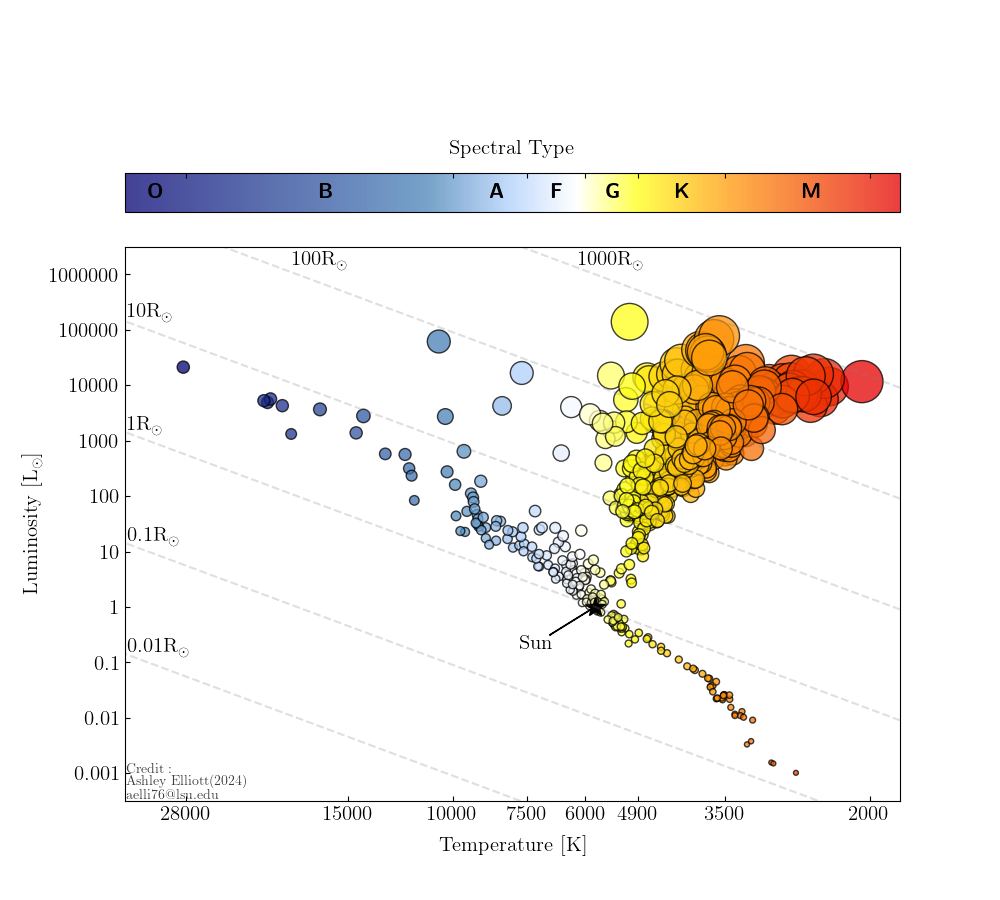
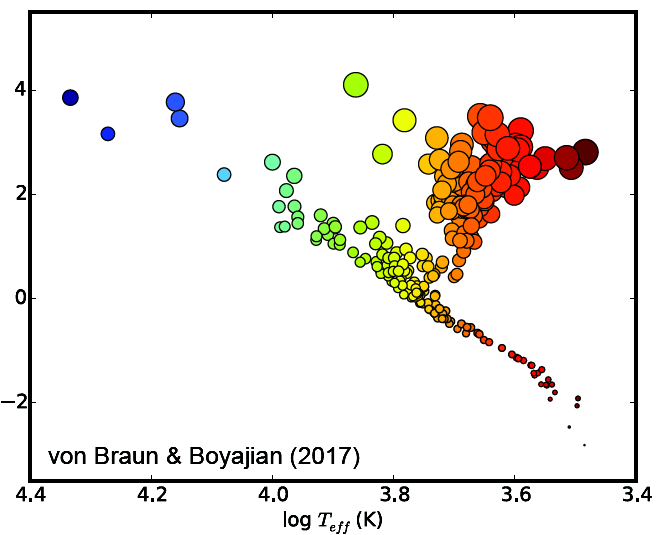
This HR diagram was created by Ashley Elliott (Graduate Student, Louisiana State University) as an update to the one seen below from von Braun & Boyajian 2017. Symbol sizes correspond to the measured diameter of the star.
This diagram consists of stars with published angular diameters measured with either lunar occultations or interferometric methods with a precision of less than 5%. Angular diameters are taken from the Jean-Marie Mariotti Center Measured Stellar Diameter Catalog for values published before 2016, and measurements from 2016 to the end of 2023 are taken from the literature. Where multiple measurements exist of the same star, we took the weighted average of the angular diameter.
Parallaxes are taken from the GAIA catalog for stars fainter than Gmag = 3, and otherwise from the Hipparcos catalog. We kept only stars with a parallax precision < 10%.
Bolometric fluxes are collected from the literature. If a bolometric flux measurement did not exist, we use published values of the star’s bolometric absolute magnitude. The reference papers for the bolometric flux measurements are listed in the accompanying data table.
The final star count for this HR diagram is 693 unique sources. Angular diameter measurement methods for these stars include lunar occultations, intensity interferometry, and long baseline optical/infrared interferometry. The angular diameters range between 0.2 mas to 21 mas, with an average value of 2.5 mas. The parallaxes range between 0.3 mas to 797 mas (corresponding to distances between 1.25 and 3224 pc), with an average of 38.6 mas (245.6 pc). Stellar radii range between 0.15 and 848 Solar Radii (R๏), luminosities range from 0.001 and 139270 Solar Luminosities (L๏) , and temperatures from 2060 and 28330 Kelvin.
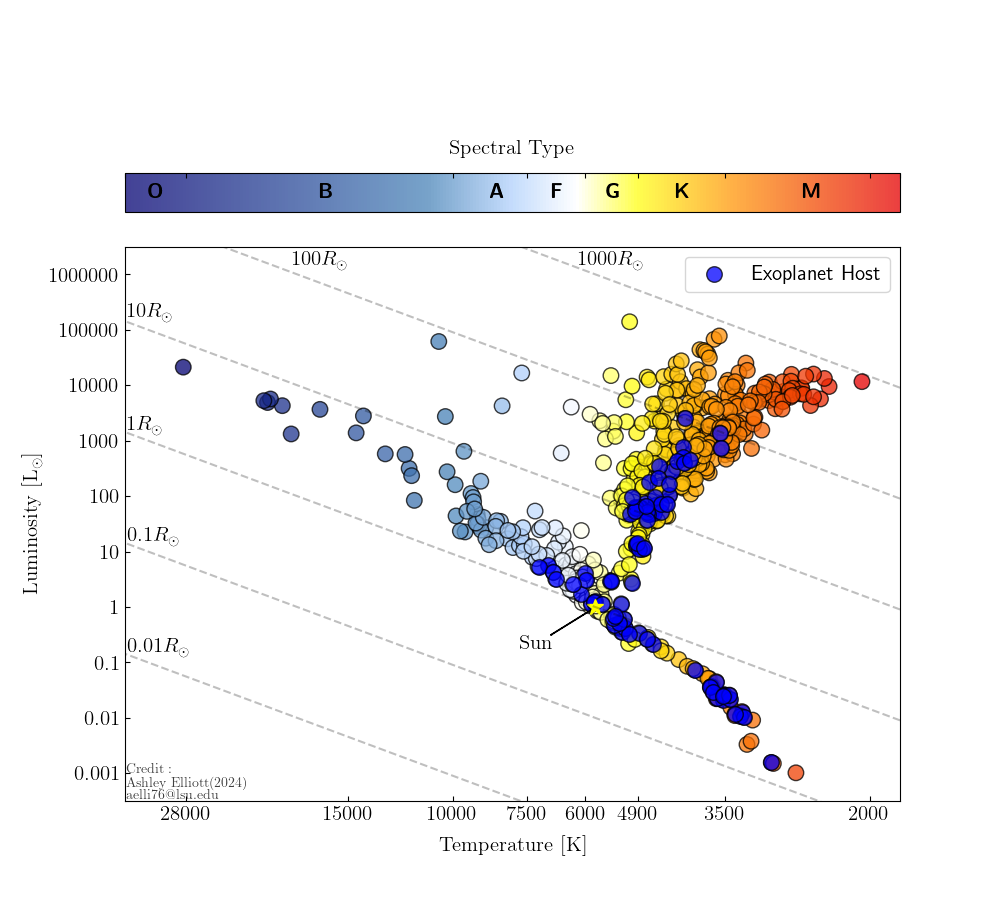
Out of the 693 unique sources, 84 stars host a known exoplanet system. Nineteen of these exoplanet host stars are M stars, 36 are K stars, 22 are G stars, and 7 are F stars (luminosity class agnostic) . Notable exoplanet host stars included are 55 Cancri (a host to 5 exoplanets), 51 Eridani (host to the first directly imaged exoplanet, 51 Eri b), ε Eridani (a sun-like star with a debris disk and exoplanet),and Proxima Centauri (the closest star to us with 2 confirmed exoplanets).
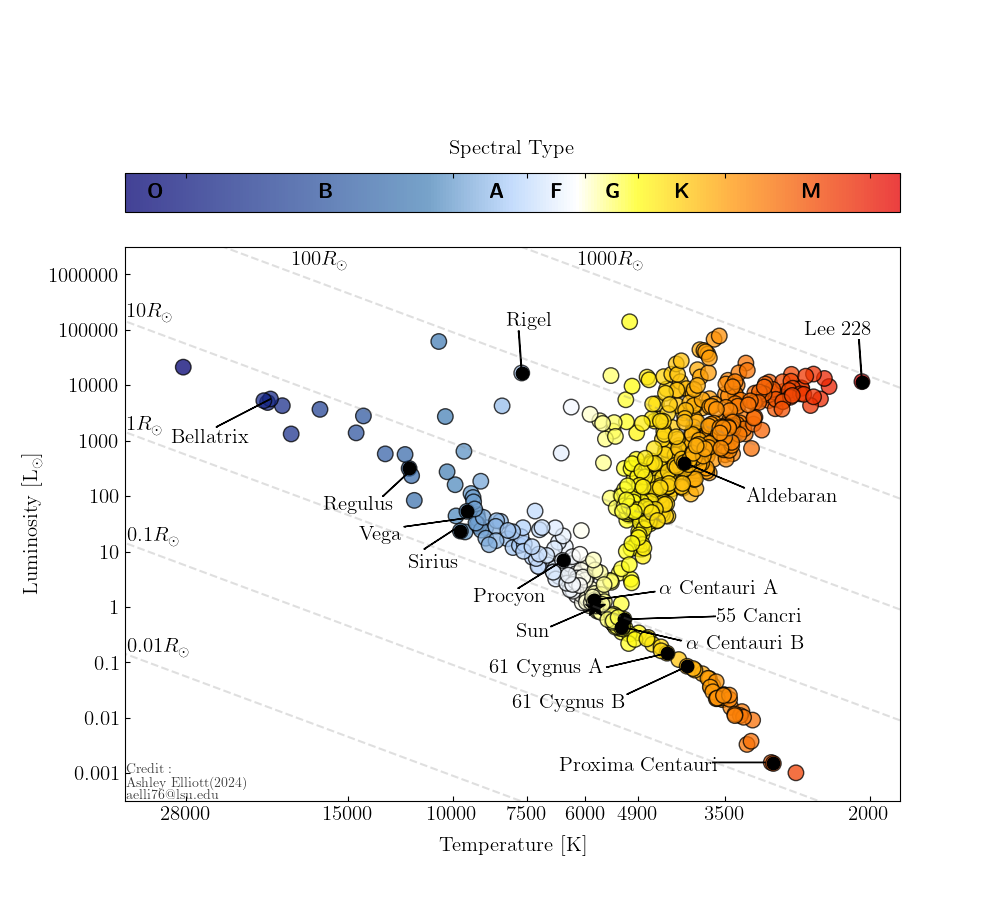
Out of the 693 unique sources, some famous stars have been directly measured, which are labeled in the plot below:
We provide a table of all measurements and references here.
A three-dimensional version of this HR diagram is shown below. In addition to the temperature along the x-axis and the luminosity along the y-axis, the z-axis displays the distance of each star in parsecs. The color map corresponds to the spectral type, which is labeled in the color bar to the right of the plot. This plot is also interactive. If you hover over each individual point, you can see the star ID, the temperature in Kelvin, the luminosity in Solar Luminosities (L๏), the stellar radius in Solar Radii (R๏), and the distance in parsecs. The plot is movable as well, allowing you to rotate and view it from different perspectives.
References:
Boyajian et al. 2012, ApJ, 746, 101
Boyajian et al. 2012, ApJ, 757, 112
Boyajian et al. 2013, ApJ, 771, 40
von Braun & Boyajian 2017, in Extrasolar Planets and Their Host Stars, Springer